Case Study
Infographics
Infographic design
Infographic design case study
Infographic design case study
Overview
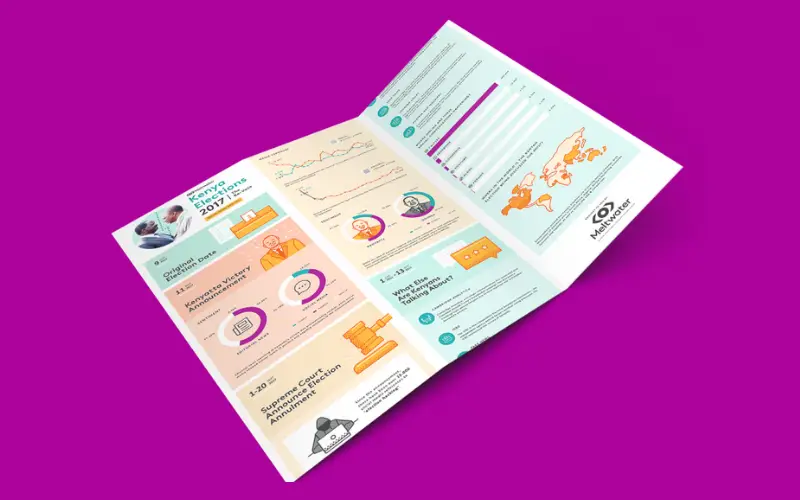
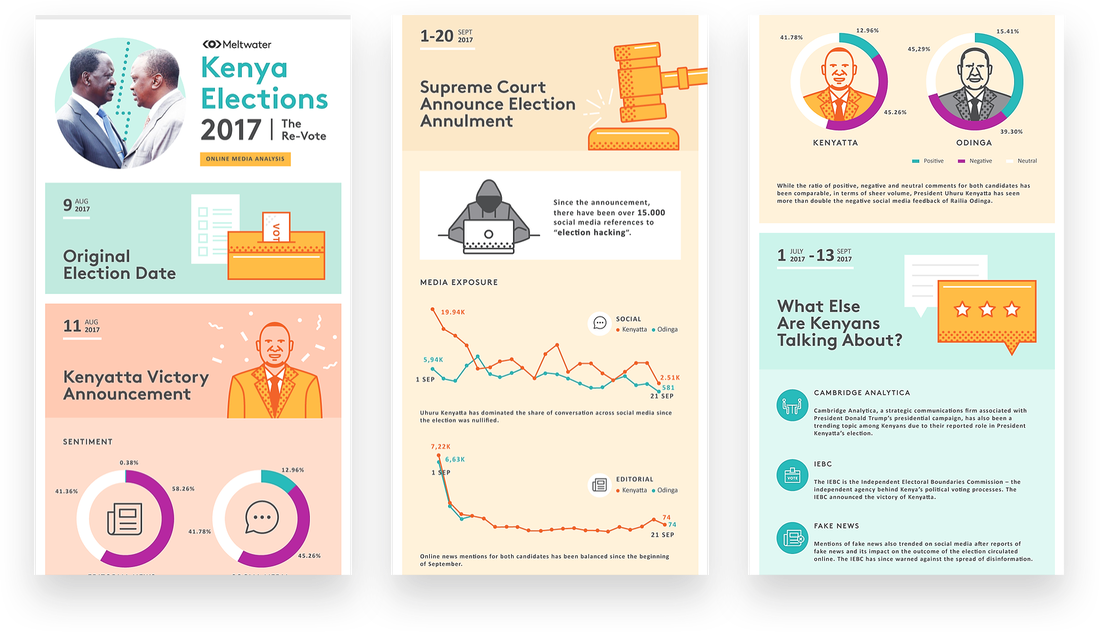
Meltwater is the word’s first global media monitoring company with 50 offices in 25 countries. Their media intelligence and social analytics software helps businesses monitor, understand, and influence the world around them. Meltwater tracked and analyzed the social media and online editorial mentions after the Kenyan election had been annulled by the Supreme Court on the 1st of September in 2017. With over 15 000 mentions of “election hacking” in Kenya, election Re-Vote was one of the hottest topics at the time. Meltwater asked us to compile their important findings into an engaging infographic that is visually appealing to large and versatile audiences.
The Goal
The goal was to create an infographic that strikes the perfect balance between engaging visuals and factual information.
The Solution
A combination of Meltwater’s brand colours, illustrations, icons and different font sizes help break down the timeline of the election and transmit key stats about the social media mentions in a clear and engaging way. We also managed to meet our client’s tight deadline and produced the infographic in an easily adaptable format to support our client’s various social media campaigns.
What We Did
Our client provided us with the data and content that we compiled into an easy to understand and visually appealing infographic.
The Challenge
Due to the nature of the project and the relevancy of the topic we had a very tight deadline to work with.
Tools We Used

Adobe Illustrator

Adobe InDesign
I wanted to create a high-quality, amazing looking infographic. Our deadline was tight and set in stone, but you guys did a fantastic job that exceeded our expectation.